Big data analytics is the result of the merging of two exciting fields - Big Data and Data Analytics.
It involves the analysis of "big data" i.e. data of large volume, lots of variety (structured, unstructured), and possibly
coming in at high velocity (think of sensor data in an "Internet of Things" [IoT] environment). As with traditional data analysis
the goal is to uncover hidden patterns, unknown correlations, market trends, customer preferences and other useful business information
that might provide a competitive edge.
NirvanaAnalytics™ by TekNirvana (shown below) is a mature and proven big data analysis framework designed to help organizations
meet the demanding and often overwhelming challenges associated with big data analysis. Although, many product companies might want you
to believe that big data analytics is primarily "selecting the right tool i.e. their tool" exercise, the truth is far from it. NirvanaAnalytics can help
with a well-defined methodology, a coordinated set of tools and techniques, and a system of systems approach that looks at the big picture
rather than tactical, point solutions.
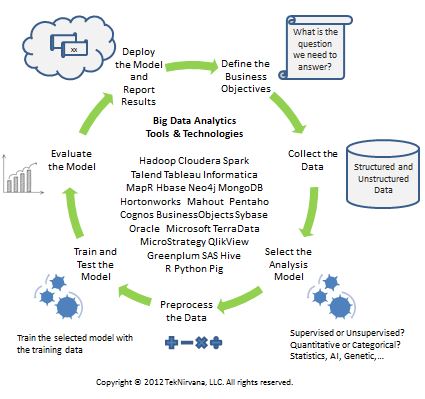
NirvanaAnalytics™ breaks up the data analytics lifecycle into seven (7) essential steps. Each of these
is described in the table below. The cyclical nature of the framework is due to the fact that the process of analyzing data is
never truly over since each success motivates an organization to explore further "new and novel" data, questions, and challenges.
| Step |
Purpose and Brief Description |
| Define the Business Objectives |
The first step is to figure out what the desired outcome is i.e. what is the question that we are trying to answer?
Defining the problem and the scope is essential to figuring out what data we will need to collect for the analysis.
This is also the stage to identify and agree upon acceptable model performance criteria such as precision, recall,
accuracy, sensitivity, etc. Models can never be perfect, just good enough, so having clear goals is critical to success.
|
| Collect the Data |
Remember, garbage in results in really stinking garbage out. That is, if you don't have the "right" data, your results will suffer no
matter how amazing your model is. Collecting the data can often be the most time and resource consuming part of the entire process,
which is why it is so critical that the first step of defining the outcomes, problem scope, model performance parameters, and identifying the "right"
data to be collected is done properly.
|
| Select the Analysis Model |
There is no "silver bullet" model. We recommend always starting with the simplest model possible such as a Naive Bayes model
or a logistic regression in the case of a classification task, or a linear model in the case of regression. Factors that
influence the model selection include the type of prediction, whether the prediction has to be justified, real-time or batch
processing of data, the number of and correlation between the features, etc.
|
| Preprocess the Data |
Beware of putting "lipstick on a pig". Even if you have the "right" data, you still may end up with incorrect predictions if
the data is not "clean". It is very unlikely that the data collected is ready to process. It will have to be prepocessed i.e. normalized, scaled,
encoded, and transformed. Features may need to be removed, others might need to be added or merged. Individual features might have
missing data, incorrect data, and outliers. The bottom line is that this step requires careful thought
and consideration for success and may need to be repeated multiple times iteratively.
|
| Train and Test the Model |
During this step we split the data into a training set and a test set. The key idea is that we want to assess our model based
on how we expect it to perform on unseen future data. Because we have limited data we will do this by using the test set,
which is a portion (typically 15-30 percent) of the data collected and set aside for this purpose. The model is trainied
using the training data. It is critical that the test data not be used during training.
|
| Evaluate the Model |
The goal here is to measure the model performance and compare with the initial metrics defined in the first step.
This step often consists of numerous iterations of steps 2 through 5 until the model performance reaches acceptable levels.
|
| Deploy the Model and Report Results |
This is where the rubber finally meets the road. At this step the model is deployed and starts seeing previously unseen (and uncollected) data.
The model's performance should be monitored over time to verify that the model is working as intended and
catch any potential data shifts/changing trends. If the process being modelled changes over time then the
model performance could degrade and steps 2-6 might have to be repeated.
|
|
|
|
NirvanaAnalytics provides comprehensive data analytics guidance and support to help organizations
- Reduce costs by finding more efficient ways of doing business
- Make faster, better, and higher confidence decisions based on real-time data from a large number of disparate data sources
- Gain a competitive advantage by helping identify and create/provide products/services that satisfy the real customer needs
NirvanaAnalytics™ Brochure
Download the Brochure (pdf)
Capability Statement
Download Capability Statement (pdf)
|
|